
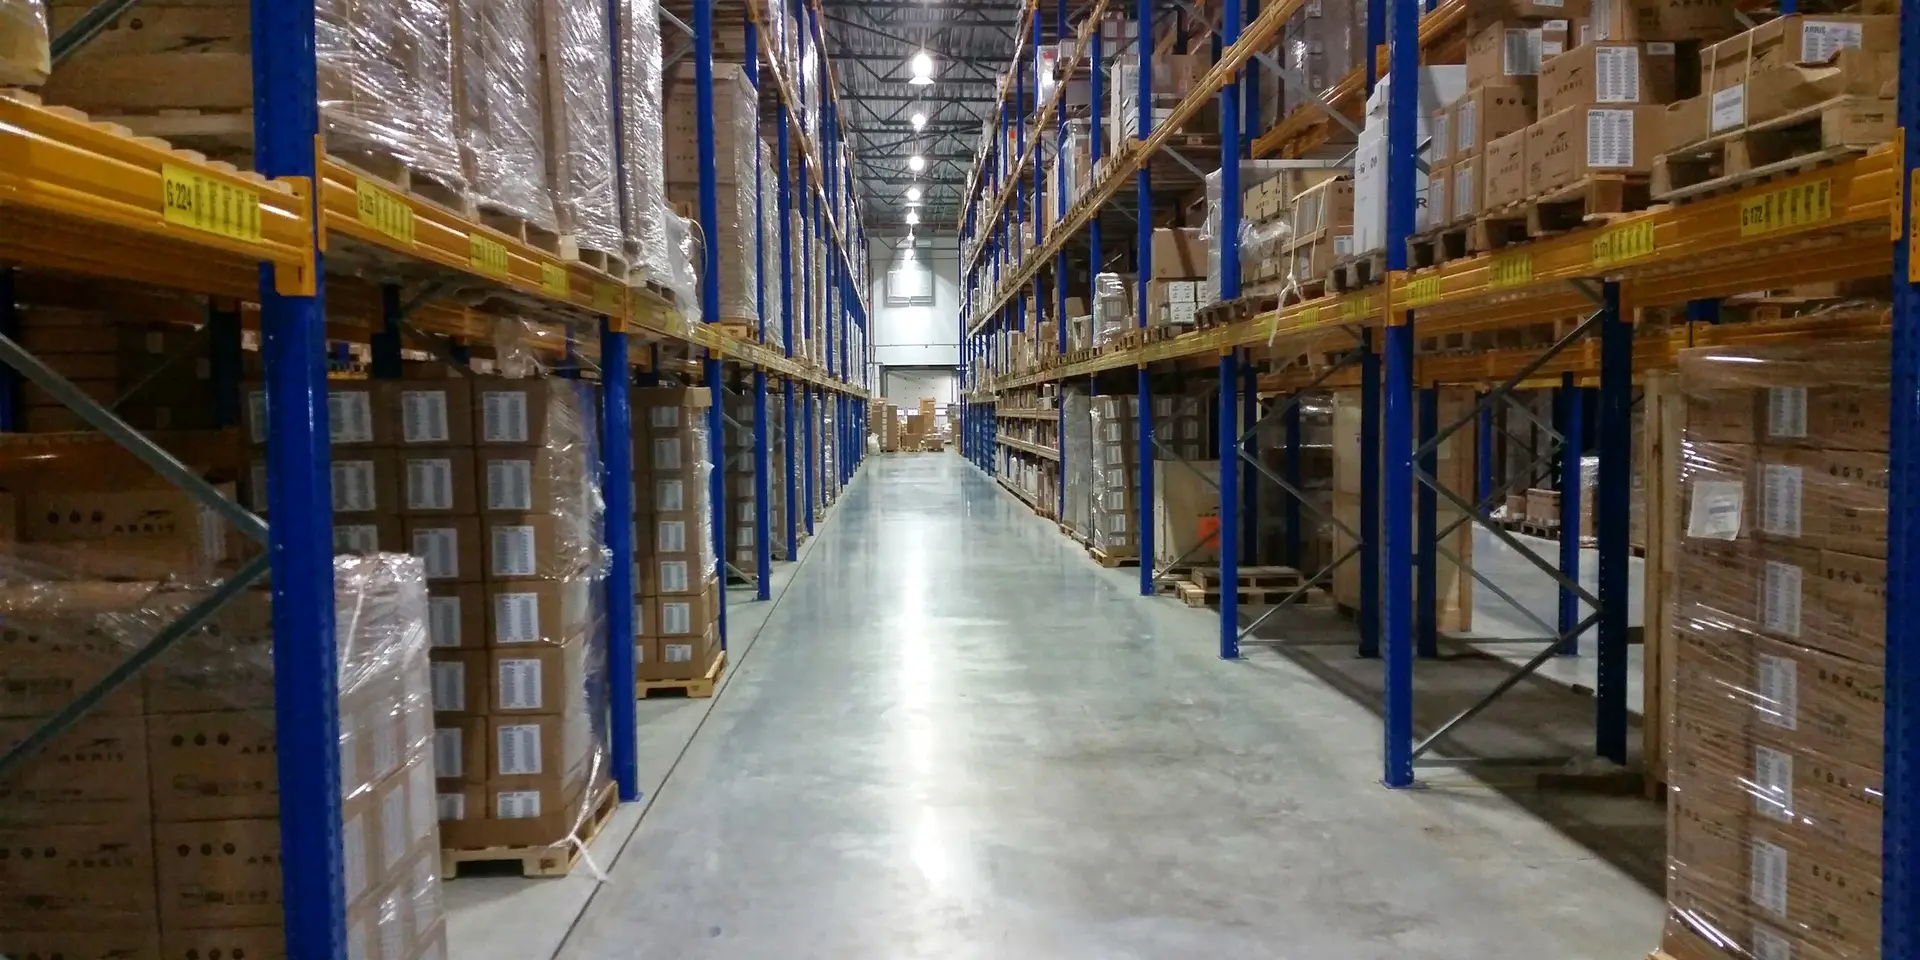
Temperature Mapping
The complete guide to temperature mapping
Temperature mapping is a study that measures how temperature is distributed across a controlled storage space over time. Calibrated data loggers are placed throughout, conditions are recorded continuously, and the results show where the space runs warmest and coldest. It delivers the objective evidence you need to qualify the space for regulated product and place permanent monitoring correctly.
What this guide covers
Temperature mapping, explained
This guide covers temperature mapping end to end. The twelve sections that follow move from what a study proves and why regulators expect one, through when a space needs mapping, how a study runs step by step, where the sensors go and how many, how long it should run and what the final report must contain, to the calibrated loggers and continuous monitoring the results depend on. Use the on-this-page list to jump straight to the part you need.
- Why it's required
- Regulated storage has to be evidenced, not assumed. A study documents that the whole volume holds specification and justifies where the permanent monitoring sensors sit.
- How long, and how many sensors
- Commonly 24 to 72 hours for a fridge, freezer or cold room, and around seven days for an ambient warehouse. Sensor numbers scale with volume and complexity: there is no universal count.
Section 01
What is temperature mapping
Temperature mapping characterises how temperature, and often relative humidity, is distributed through a controlled storage area over time. Calibrated data loggers are placed at multiple positions inside the space, conditions are recorded continuously for a defined period, and the results are analysed to establish where it runs warmest, where it runs coldest, and how much it moves through a normal operating cycle.
The purpose is evidence. Before a space can be claimed as fit for regulated product, you need objective data showing it holds the required conditions in real operating circumstances, not at the thermostat setpoint on a quiet afternoon.
A map is not a spot check
A spot check shows you what the temperature was at one point, at one moment. A mapping study shows you how temperature is distributed across the whole space, continuously, under real operating conditions.
A map is not continuous monitoring
A mapping study is a one-time (or periodic) qualification exercise. It establishes where the extremes are and justifies where to place the permanent monitoring sensors. Continuous monitoring is what happens afterwards.
A setpoint is not evidence
A cold room set to the right temperature does not prove the whole space holds it. A mapping report does, because it covers every significant position across the volume under real conditions, including load changes and door openings.
Section 02
Why temperature mapping matters for compliance
A cold room set to the right number is not evidence that the cold room holds it. What an inspection examines is documented, traceable proof that the whole space stayed within specification, and a rationale for why the monitoring sensors sit where they sit. That is what a mapping study produces, and it is the common foundation under every framework a UK quality team is likely to cite.
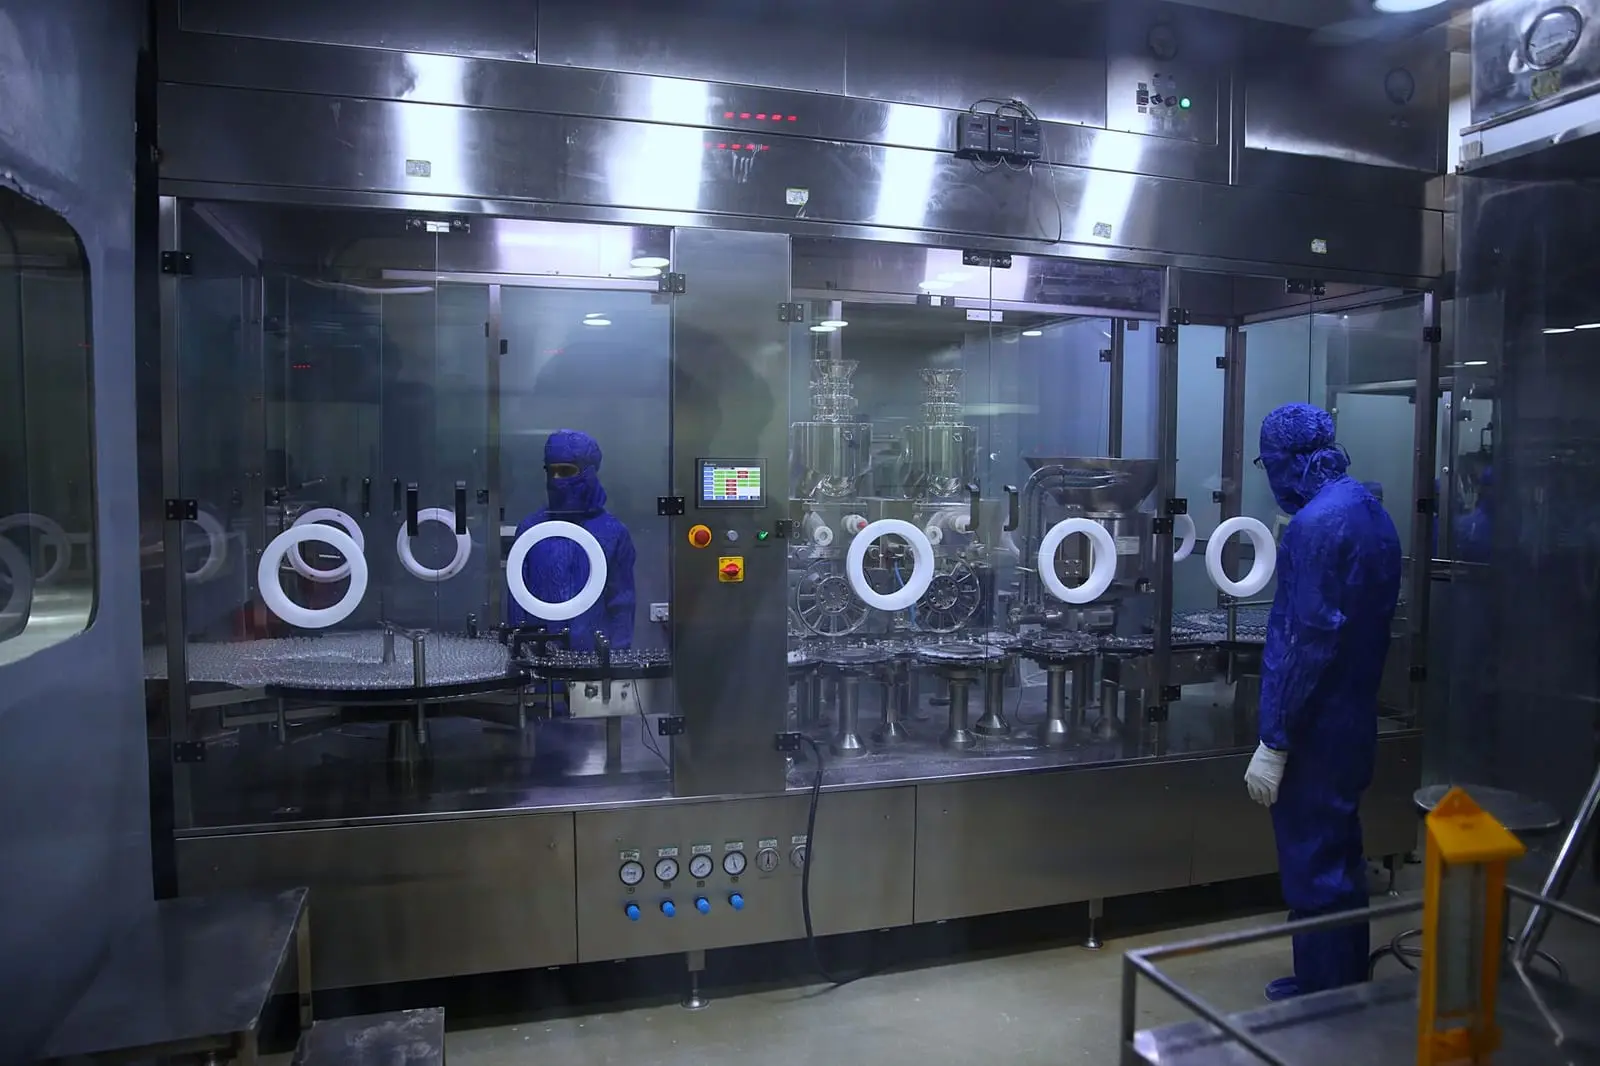
MHRA and UK GDP
Under UK Good Distribution Practice, the MHRA expects storage areas to be temperature mapped before use under representative conditions, with documented evidence justifying how many monitoring sensors are used and where they sit, and with requalification triggers defined in the quality system.
WHO TRS 961, Annex 9
WHO Technical Report Series 961, Annex 9 is the international model guidance for storing and transporting time and temperature sensitive pharmaceutical products. Technical Supplement 8 amplifies its mapping requirements; many UK quality teams use it as the practical reference when designing a study.
EU GMP and GDP
European Good Manufacturing Practice and Good Distribution Practice require environmental monitoring of production and storage areas, with sensor placement justified by risk and performance data.
In practice the trigger for most studies is an audit finding, a new facility, or a requalification the quality system has fallen behind on. Expectations have become more specific over time: placement justified by data, seasonal conditions accounted for, calibration traceable to national standards, and a report a third party could follow and reproduce. Under EU GDP, mapping a storage area before use is the first step; continuous pharmaceutical cold chain monitoring is what proves it keeps holding afterwards. For the GxP and life-science compliance picture specifically, see Eltek in life sciences compliance.
Section 03
When you need a mapping study
Mapping is not a one-off at commissioning. It is a living part of the quality system, and five circumstances commonly call for a study or a repeat.
A new facility or new storage equipment
Any new controlled space, a warehouse bay, cold room, refrigerator, freezer or stability chamber, is mapped before regulated product goes into it. Commissioning without a study leaves no objective basis for claiming the space meets its specification.
Seasonal extremes not yet covered
Distribution in a real building changes between summer and winter. Warm ambient air drives up temperatures near doors and external walls; cold weather deepens stratification and creates cold spots at poorly insulated panels. Studies are commonly repeated to capture both extremes.
A significant change to the space
Changes to racking or layout, HVAC or air-handling modifications, a materially different load pattern, or building fabric work such as new insulation or doors. Any of these can invalidate the previous map.
An audit finding
If an inspector finds that sensor placement is not justified by performance data, or that the existing study is out of date or does not cover relevant conditions, a re-map is the standard response.
Periodic review in the quality system
Re-mapping is risk-based: no regulation prescribes a fixed interval. Many organisations review annually whether a re-map is needed and requalify on a defined cycle, but that is organisational practice, not a regulatory figure.
Section 04
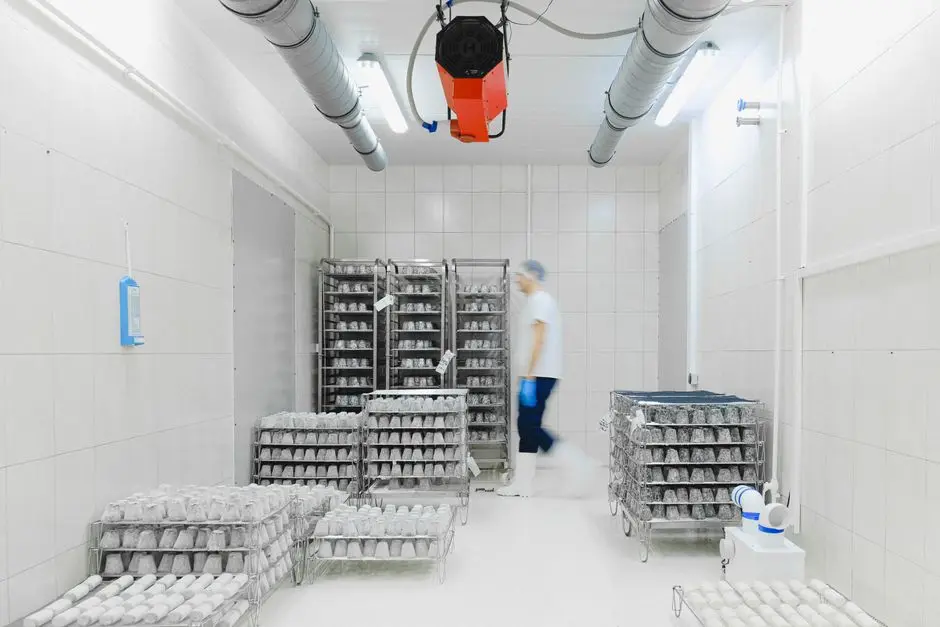
What does a temperature mapping study involve in the UK
In the UK, a temperature mapping study is the structured exercise an organisation (or its validation provider) carries out to prove a controlled space holds its specified conditions throughout its whole volume. It follows six stages: write and approve the protocol and acceptance criteria; select and verify calibrated, traceable sensors; develop the sensor placement plan by risk assessment, at the positions most likely to see the extremes; run the study across a full operating cycle, empty and loaded; analyse the data for hot and cold spots; then report and site the permanent monitoring sensors at the worst case. Eltek supplies the loggers, sensors and Darca software the study depends on.
How a temperature mapping study works, step by step
A well-run study follows a defined sequence, and each step leaves a record that becomes part of the final report. The order matters: every decision downstream is only as defensible as the protocol that authorised it.
- 01
Write and approve the protocol
Nothing is placed until the protocol is approved. It sets the acceptance criteria, the placement rationale, the duration, the operational conditions to be covered (empty and loaded, normal door-opening patterns, any worst-case scenario), the equipment to be used and the calibration requirements. Every later step is governed by it, and any deviation is recorded and assessed in the report.
- 02
Select and verify calibrated loggers
The loggers must carry current calibration certificates traceable to national measurement standards (in the UK, normally UKAS-accredited calibration to ISO/IEC 17025), valid at the time of the study, not lapsed. They must cover the temperature range being mapped, achieve the accuracy the acceptance criteria demand, and log frequently enough to capture transient events such as door openings and compressor cycles.
- 03
Develop the placement plan
The plan fixes where every logger sits, in three dimensions, and records why. It targets the positions most likely to see the extremes: corners, the highest and lowest product levels, positions at doors and loading bays, positions influenced by heat and cooling sources, and a centre reference. The plan is documented and becomes part of the report.
- 04
Run the study, empty and loaded
Mapping is commonly performed in both empty and loaded states, because stock changes airflow and thermal mass, and the two conditions can produce different worst-case positions. Through the run, normal operations continue: door openings, loading and unloading, cleaning cycles. A study conducted in artificial calm does not describe the space you actually operate.
- 05
Analyse the data
Every logger is downloaded and reviewed to find the warmest positions, the coldest positions, the magnitude of variation across the space, and any position that breached the acceptance criteria. Mean kinetic temperature is commonly calculated where product stability is the concern, because it weights higher temperatures more heavily than a simple average.
- 06
Report, then place the permanent sensors
The report documents the protocol, the equipment and its calibration, the placement plan, the raw data, the analysis, the deviations and the conclusions. Its primary output is a decision: where the permanent monitoring sensors go. Put them at the worst-case positions the study found and continuous monitoring reflects reality; put them where cabling was easiest and you may be watching the one spot that never fails.
Biological sample storage
How do you temperature-map a -80 degree (ULT) freezer, step by step
Ultra-low (-80 degree) freezer mapping is a study that places multiple calibrated sensors through the freezer to characterise its temperature distribution, its hot and cold spots, under real conditions. It shows where to site permanent monitoring probes and proves the unit is fit to store -80 degree samples, the evidence GxP and GDP expect before use.
A ULT freezer is never a single temperature. The air near the door, the corners and the centre can differ, and pull-down after loading or a door-opening all move those figures. Mapping characterises that distribution so you know where the warmest point is, site your permanent monitoring probe there, and can show the unit performs before you trust irreplaceable samples to it.
The method is the same six-step study set out in how a study works, step by step above, adapted for the -80 degree range. Three points carry more weight at ultra-low temperatures than anywhere else.
-
Capture pull-down and door-opening recovery
Record pull-down after the freezer is loaded and recovery after a defined door-opening, not just steady state. Those transients are where a -80 degree unit is most likely to drift, so a study run in artificial calm understates the real risk.
-
Site the permanent probe at the worst case
Place the ongoing monitoring probe at, or referenced to, the warmest location the study found, so day-to-day monitoring reflects the real risk rather than the easiest cabling run.
-
Re-map on a risk-based schedule
Document the study as validation evidence, then re-map after significant changes or on a risk-based schedule, rather than treating one study as permanent.
EU GDP expects an initial temperature-mapping exercise before use, repeated per risk assessment or after significant modification, with monitoring equipment calibrated at defined intervals. Mapping is how a lab or distributor produces that evidence for a -80 degree freezer. No study makes a facility compliant by itself: configuration depends on system implementation and customer processes. Eltek supplies the loggers, probes and Darca software the study and the continuous monitoring that follows depend on; validation and the process stay yours. For the low-temperature case in practice, see our ULT freezer mapping and validation guide.
Section 05
Sensor placement and how many sensors
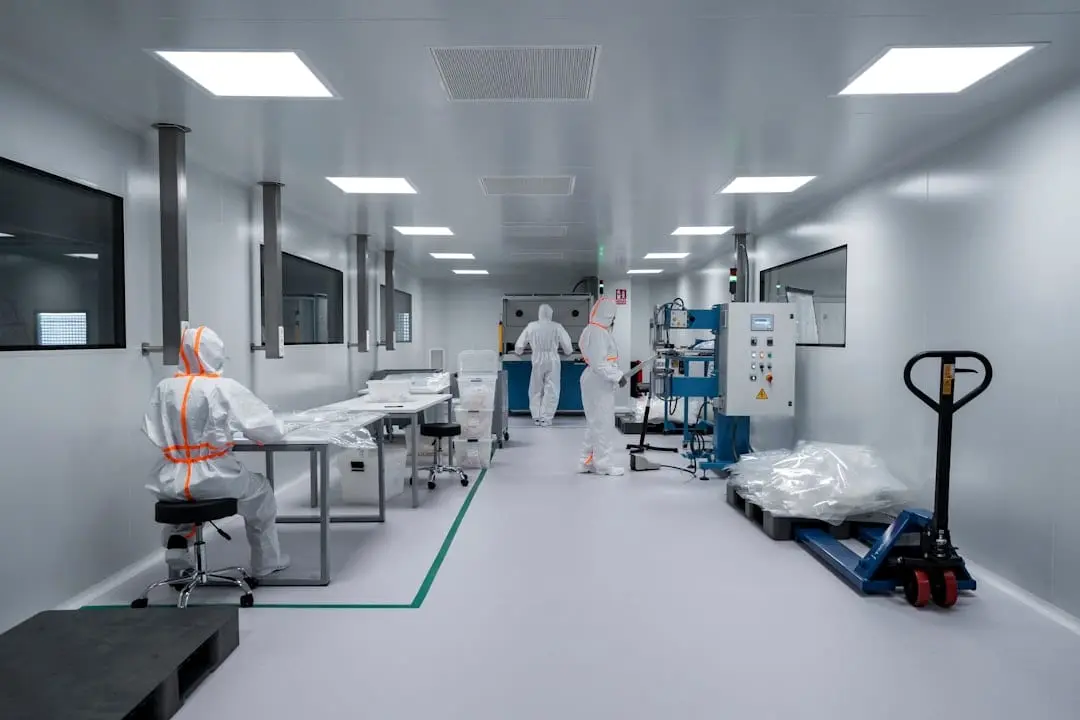
The principle governing placement is worst-case coverage. A study is not trying to show that a space is uniformly comfortable; it is trying to find the positions most likely to drift outside specification, so that those are the positions monitored continuously once mapping is done.
The corners
Corners sit at the end of airflow paths and accumulate both warm and cold extremes, depending on what is nearby. They are covered at low, mid and high levels where the space allows.
Highest and lowest levels
Warm air rises and cold air settles, so stratification top to bottom is one of the most consistent findings in mapping. Upper racking in a tall warehouse can run persistently warmer than floor level.
Doors and loading bays
Every opening admits ambient air. Positions at doors, at the height of the opening, and around dock levellers typically show the largest transient excursions and are the most common source of a breach.
Heat sources
Lighting, HVAC discharge air, electrical equipment and sun-facing external walls all act as local heat sources. Any product position within their influence needs a logger.
Cooling sources
Evaporator coils, cooling units and cold bridges create localised cold spots. In a chilled space, stock too close to a coil risks dropping below the lower limit, which is as much a deviation as running warm.
A centre reference
A logger at the centre of the space gives the reference point for calculating the overall gradient and for making sense of the airflow pattern the extremes imply.
How many sensors
There is no universal sensor count, and no single figure that satisfies every framework. The number scales with the volume of the space, its shape, and the complexity of its airflow and thermal behaviour, and the protocol has to justify both the count and the positions.
The working test is whether any significant microclimate could go unobserved. A small room with one door and simple airflow is characterised by a handful of loggers. A large pharmaceutical warehouse with multiple loading bays, high racking and several HVAC zones needs considerably more. Work the space methodically in three dimensions: low, mid and high levels, each wall, every door, and every known heat and cooling source. Where a position is arguable, include it. An extra logger for the duration of a study costs almost nothing next to a permanent sensor installed in the wrong place.
If your organisation supplies into the US or handles US-regulated product, USP <1079.4> gives volume-banded probe-count recommendations and should be worked to directly rather than paraphrased.
Work the space in three dimensions
- Low, mid and high levels, wherever product sits
- Every corner, at more than one height
- Every door, at the height of the opening
- Every heat source: lighting, HVAC discharge, sun-facing walls
- Every cooling source: coils, discharge air, cold bridges
- A centre reference, to read the gradient against
Where a position is arguable, include it. The protocol has to justify the count either way.
Common mistakes
Common mistakes to avoid
Most mapping failures come down to the same handful of oversights. Recognising them in advance is easier than finding them in an audit.
Mapping only in mild weather
Running the study in comfortable conditions and missing the summer and winter extremes means the map does not describe the space under the conditions it actually operates in.
Placing sensors by convenience, not risk
Siting loggers where cabling is easy rather than where the data and thermal performance justify leaves the most important positions unobserved.
Treating a study as permanent
Not re-mapping after a significant change to the space, such as a racking reconfiguration, HVAC modification or change in load pattern, means the map no longer describes what is actually there.
Confusing mapping with monitoring
Assuming the one-off study is sufficient evidence going forward, rather than recognising it as the qualification step that justifies where the permanent continuous monitoring sensors sit.
Not sure your study covers everything it should? Speak to an Eltek engineer about the loggers, probes and Darca monitoring software that back a robust mapping study.
Speak to an Eltek expertSection 06
How long should a mapping study run
Long enough to cover the operating cycle, which makes duration a risk-based judgement rather than a single mandated number. In common practice, temperature-controlled units such as refrigerators, freezers and cold rooms are mapped over roughly 24 to 72 hours, while ambient warehouses are commonly mapped across a full seven-day period.
The reason warehouses take longer is operational variation. Monday morning despatch after a quiet weekend produces a different thermal signature from Thursday afternoon at full throughput. A building that empties overnight behaves differently from one running continuously. A cold room door opened fifty times on a busy day tells you something a Sunday never will. Seven days captures the working days, the nights and a weekend, so the worst case in the report is a real worst case.
Seasonal extremes are handled either by repeating the study in summer and in winter, or by extending it to span the change. The test is always the same: has the study demonstrated that the space holds its specification across the full range of conditions it will actually meet in use. Where that is in doubt, run longer.
Typical study duration
- Refrigerator, freezer, cold room
- 24 to 72 hours
- Ambient or pharmaceutical warehouse
- around 7 days
- Seasonal coverage
- repeat in summer and winter
Common practice, not a regulatory minimum. No framework mandates a universal duration.
Section 07
Temperature mapping by environment
The principles hold everywhere. What changes is the pattern to expect and the risk that bites first.
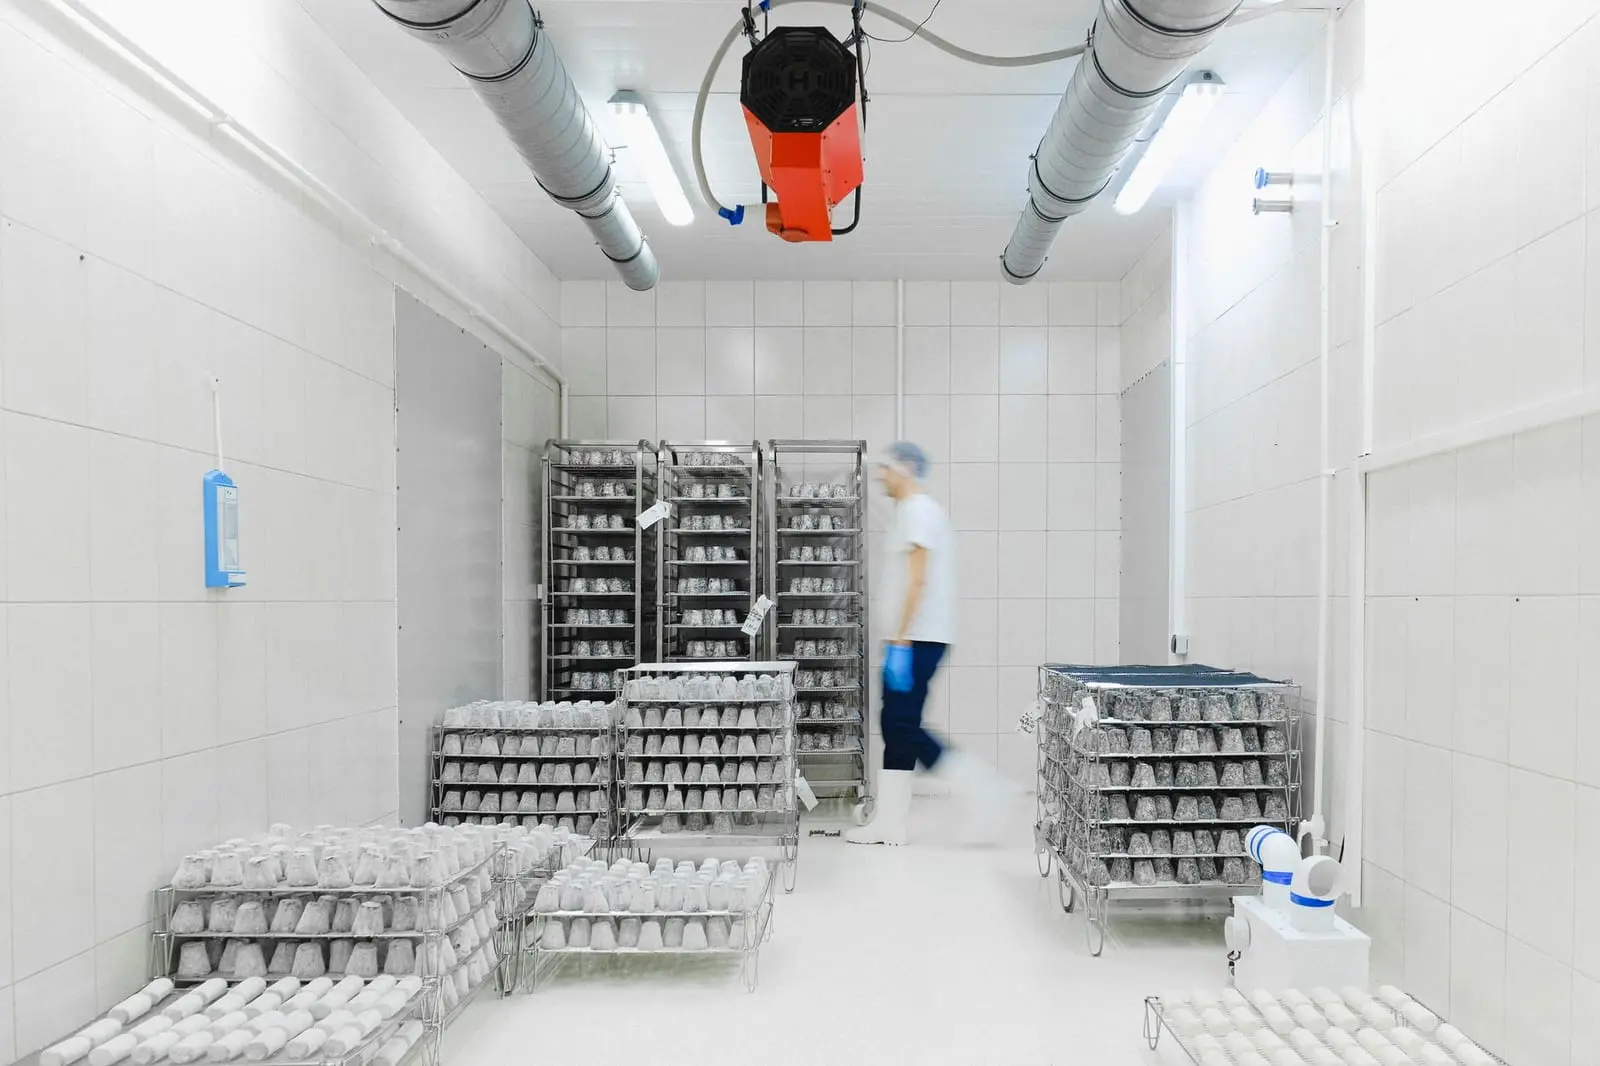
Warehouse and pharmaceutical warehouse
The most complex case: large volume, high racking, multiple loading bays and extensive HVAC mean conditions vary considerably zone to zone. Stratification matters most here, because upper-tier racking can run consistently warmer than the floor, and loading bays are the usual source of excursions. Capturing both summer and winter conditions is standard practice.
Cold room and cold store
A cold room held at 2 to 8 degrees shows strong stratification and pronounced door-opening effects. The area immediately inside the door is usually warmest, while positions close to the evaporator discharge can run cold. Because a dense load changes airflow substantially, the empty and loaded comparison earns its keep here.
Refrigerator
A pharmaceutical-grade refrigerator maps like a cold room at small scale. Attention goes to the top shelf, the bottom shelf or drawer, and the door shelf, which is the most exposed to ambient air on every opening. Those three positions commonly disagree, and the gradient between them is the finding that matters.
Freezer and ULT freezer
At -80 degrees, gradients are steeper, equipment performance varies more with ambient conditions, and door-seal condition becomes critical. Loggers and probes must be rated for the full range, with calibration that actually covers it, a point where generic equipment often falls short.
Clean room
Temperature and humidity mapping forms part of the wider environmental qualification of a classified space. Distribution is dominated by the HVAC design, particularly supply diffuser and return grille positions, so mapping usually runs alongside the full qualification programme for a new or modified room.
Incubator
A smaller, contained problem: positions cover shelf height and proximity to the heater or fan. The risk users underestimate is the gradient between shelves, which can be larger than expected in older or heavily loaded units.
Stability chamber
Stability testing demands tight temperature and humidity tolerances across the whole chamber volume, so even small gradients are significant. Mapping forms part of qualification for a new chamber or after a significant service, with positions at multiple heights and depths.
For the low-temperature case specifically, our ULT freezer mapping and validation guide sets out the six oversights laboratories most often make at -80 degrees, from mapping an empty freezer to never validating the alarm strategy.
Section 08
What the mapping report must show
The report is the deliverable, and it has to stand alone. A reader who was not there should be able to follow what was done, why, and what was found, without a conversation.
- The approved protocol
- Or a reference to it, including the acceptance criteria and any approved deviations from the plan.
- Equipment list and calibration certificates
- Serial numbers, calibration dates and the calibration laboratory. Every logger used needs a current certificate traceable to national standards, appended or referenced.
- The sensor placement plan
- A diagram or table giving each logger's position in three dimensions, with the rationale for choosing it.
- The complete raw dataset
- Time-stamped readings from every logger for the full duration, unedited and untruncated.
- Hot spots, cold spots and variation
- The position and period of the highest and lowest recorded temperatures, the spread across the space, and mean kinetic temperature where product stability is the concern.
- Pass or fail against the criteria
- A clear conclusion for each condition studied: empty and loaded, and each season where seasonal mapping applies.
- Deviations and their assessment
- Any departure from the protocol, and an assessment of its impact on the validity of the results.
- Permanent sensor placement recommendations
- The study's real output: where the ongoing monitoring sensors go, with the data-based reason for each position.
The report joins the site's validation documentation and is produced on request. Its weight rests entirely on the integrity of the data underneath it, which is why traceable calibration and time-stamped, non-editable records are requirements rather than refinements. No product makes an organisation compliant on its own: equipment supplies the measurement and the evidence, while validation and process stay yours.
Section 09
From mapping to continuous monitoring: the equipment your study depends on
A study ends with a decision about where the permanent sensors go. The equipment that then does the watching has to meet the same standard as the loggers that produced the mapping data, because the evidence chain runs continuously from one to the other. Eltek makes the loggers, probes and software at both ends, for the study and for the permanent monitoring that follows. Your protocol defines the count and the positions; you select the equipment to match.
Wireless GenII loggers and transmitters
GenII wireless transmitters, such as the GD14e multi-point temperature transmitter, report to a receiver-logger without signal cabling, which is what makes dense placement practical: corners, high racking and door positions can all be covered without routing cable through a working space. The receiver-logger buffers locally, so a network or power interruption delays data rather than losing it, and a study is not invalidated by a gap in the record.
Wired PT resistance probes for critical fixed points
Where a position demands the highest accuracy, such as proximity to an evaporator coil or a stability chamber shelf, Eltek's wired 3-wire and 4-wire PT resistance probes deliver it, feeding a multi-channel logger that captures several measurement points from one unit. Where a 4-wire RTD point suits a wireless transmitter instead, the GD52a 4-wire RTD temperature transmitter carries the same probe type into the GenII network.
Calibration traceable to national standards
Every sensor used as evidence needs a current calibration certificate traceable to national measurement standards; in the UK that traceability is normally demonstrated through UKAS-accredited calibration to ISO/IEC 17025. Calibration is not paperwork, it is the basis of the measurement claim. A reading from an uncalibrated sensor is an opinion.
Darca for the monitoring the study justifies
The map says where the permanent sensors belong. The Darca Solutions Suite is what watches them: Collect measures conditions across wired and wireless sensors, Connect moves the data securely from site to software with SMS and email alarm escalation, and Command provides the live dashboards, alarm handling and scheduled reporting across every site and zone. Records are time-stamped and non-editable with full audit trails, which is what makes them usable as evidence under 21 CFR Part 11, EU GMP Annex 11 and GxP workflows generally.
Section 10
Proof: Eltek equipment in mapping and validation work
 Life Sciences
Guide
Life Sciences
Guide
Eltek best-practice guide
ULT freezer mapping and validation
At -80 degrees the margins are unforgiving: steeper gradients, greater sensitivity to ambient conditions, and door-seal condition as a live variable. Our best-practice guide sets out the six oversights laboratories repeat, among them mapping an empty freezer instead of a realistic worst-case load, skipping door-open events, and confusing periodic mapping with continuous monitoring.
Read the case study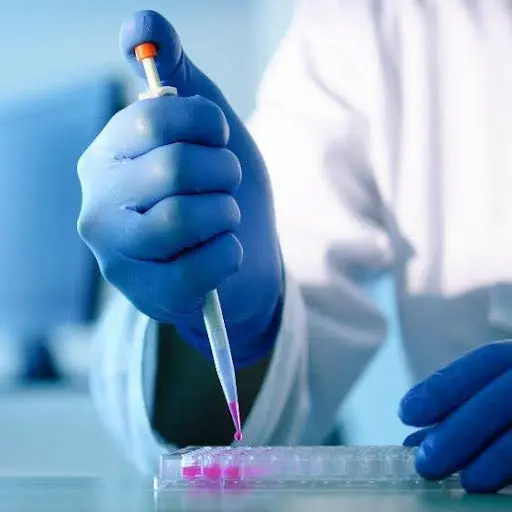 Life Sciences
A leading UK university biobank
GENII monitoring for a -80 degree university biobank
GenII loggers monitor a low-temperature estate spanning -80 degree ULT freezers, cryogenic vapour-phase storage and backup freezers across multiple rooms and buildings. The deployment delivered continuous gap-free logging with local buffering through power and network interruptions, multi-stage email and SMS alarms, and time-stamped non-editable records supporting GxP-aligned workflows, replacing manual checks that were never fully auditable.
Read the case studySection 11
Temperature mapping: frequently asked questions
What is temperature mapping?
Temperature mapping is the systematic placement of calibrated data loggers at multiple positions throughout a controlled storage area, such as a warehouse, cold room, refrigerator, freezer or stability chamber, to record how temperature varies across the space and over time. The study identifies hot and cold spots, producing the evidence needed to show the environment holds its specification and to decide where permanent monitoring sensors belong.
Why is temperature mapping required?
Because a setpoint is not evidence. Regulators expect documented proof that a controlled space maintains its specified conditions throughout the whole volume, under real operating conditions, and that monitoring sensor positions are justified by data rather than convenience. UK GDP under the MHRA, WHO Annex 9 and its mapping supplement, EU GMP and GDP, and the USP storage chapters all rest on that principle. A mapping study is how the evidence is produced.
How many sensors are needed for a temperature mapping study?
There is no single universal count. The number scales with the volume of the space, its shape, and the complexity of its airflow and thermal patterns, and the protocol must justify both the count and the placement. The guiding principle is worst-case coverage: enough loggers that no significant microclimate goes unobserved, covering corners, high and low levels, doors, heat and cooling sources, and a centre reference. A small incubator may need a handful; a multi-bay warehouse needs considerably more. For US-regulated product, USP <1079.4> gives volume-banded recommendations and should be worked to directly.
How long does a temperature mapping study take?
Long enough to cover the full operating cycle, which is a risk-based judgement rather than a single mandated figure. In common practice, temperature-controlled units such as refrigerators, freezers and cold rooms are mapped over roughly 24 to 72 hours, while ambient warehouses are commonly mapped across a full seven-day period so working days, nights and a weekend are all captured. Studies are then repeated, or extended, to cover summer and winter extremes.
Why does a -80 degree (ULT) freezer need temperature mapping before use?
Because temperature is not uniform inside the freezer, and samples fail where it is warmest. Mapping finds the hot and cold spots under real conditions, shows the unit can hold -80 degrees across its working volume, and tells you where to site the permanent monitoring probe. EU GDP expects this mapping exercise before use.
How do you temperature-map a -80 degree (ULT) freezer?
A ULT freezer study follows the same six steps as any mapping study, adapted for the -80 degree range. An approved protocol sets the acceptance criteria, the duration and the conditions to be covered; calibrated loggers and probes rated for the full range are placed at the positions most likely to see the extremes, typically the corners, the highest and lowest levels, the area around the door seal and a centre reference, because at ULT temperatures gradients are steeper, equipment performance varies more with ambient conditions, and door-seal condition becomes critical; the freezer is then recorded continuously over a representative period, commonly in the region of 24 to 72 hours; the data is analysed for the warmest and coldest positions and any breach of the acceptance criteria; and the report justifies where the permanent monitoring sensors belong. The one point where generic equipment often falls short is calibration that genuinely covers -80 degrees. Eltek's wireless GenII loggers and wired PT resistance probes, feeding Darca software, are commonly used both for the study and for the continuous monitoring that follows it.
Does mapping make my freezer or facility compliant?
No. Mapping is essential evidence, but compliance is a validated, procedurally controlled process the organisation owns. The study proves the unit's performance and supports GxP and GDP expectations; validation, procedures and ongoing monitoring remain your responsibility. Configuration depends on system implementation and customer processes.
What is the difference between thermal mapping and temperature mapping?
In GxP storage and distribution they mean the same thing: placing calibrated sensors through a space to characterise how temperature is distributed over time. The terms are used interchangeably. The one caution is that "thermal mapping" also has unrelated meanings elsewhere, including infrared thermography for building and electrical surveys, and road-surface thermal mapping for winter gritting, so "temperature mapping" is the less ambiguous term to use in a regulated context.
What is the difference between temperature monitoring and temperature mapping in a laboratory?
They are two stages of the same evidence chain rather than alternatives. Temperature mapping is a one-time or periodic qualification exercise: calibrated loggers are placed throughout a space, such as a laboratory refrigerator, freezer, incubator or stability chamber, to characterise how temperature is distributed across the whole volume under real operating conditions and to identify where the extremes are. Temperature monitoring is what happens afterwards: permanent sensors watch the specific positions the mapping study justified, continuously, so any excursion is caught as it occurs. In short, mapping establishes where the extremes are and decides where the monitoring sensors belong; monitoring then keeps watch at those positions once they are placed. A setpoint on its own is not evidence that either is being done, because it does not prove the whole space holds its specification; the mapping report proves it does, and monitoring proves it continues to.
What does WHO Annex 9 say about temperature mapping?
WHO Technical Report Series 961, Annex 9 is the model guidance for storage and transport of time and temperature sensitive pharmaceutical products, and mapping is addressed by its Technical Supplement 8, "Temperature mapping of storage areas", which amplifies section 4 of the annex. The supplement sets out the principles of a study, including characterising the space under representative conditions and accounting for seasonal variation, along with calibration and documentation expectations. Supplement 7 covers qualification of temperature-controlled storage areas.
How often should temperature mapping be repeated?
Re-mapping is risk-based, and no regulation prescribes a fixed interval. It is triggered by events: a new facility or new equipment, changes to layout, racking, HVAC or load pattern, seasonal extremes not previously covered, excursions or adverse monitoring trends, or an audit finding. Beyond those triggers, the interval is whatever the quality system defines and can justify. Many organisations review annually whether a re-map is needed and requalify on a defined cycle, but that is organisational practice rather than a regulatory figure.
What should a temperature mapping report include?
Enough for a third party to reconstruct the study without asking questions: the approved protocol and acceptance criteria; the equipment list with serial numbers and current calibration certificates traceable to national standards; the placement plan with its rationale; the complete unedited time-stamped dataset; analysis identifying hot spots, cold spots and mean kinetic temperature where relevant; a clear pass or fail against the criteria for each condition studied; any deviations and their impact; and the recommended permanent sensor placement with the reason for each position.
Further reading
Further reading and references
The standards and guidance documents a UK quality team is likely to draw on when designing or reviewing a temperature mapping study.
WHO Technical Report Series 961, Annex 9
Model guidance for storing and transporting time and temperature sensitive pharmaceutical products. The primary international reference for storage qualification and temperature mapping.
- Technical Supplement 8, "Temperature mapping of storage areas": amplifies section 4 of Annex 9 with detailed mapping requirements.
- Technical Supplement 7: qualification of temperature-controlled storage areas.
EU GMP Annex 11
Sets the expectations for computerised systems used in manufacturing and storage, including the systems that hold mapping and monitoring records: audit trails, access control, data integrity and retention. Relevant wherever electronic records are used as GMP evidence.
USP General Chapter <1079> and <1079.4>
Good storage and distribution practice for drug products. <1079.4>, "Temperature Mapping for the Qualification of Storage Areas", gives volume-banded probe-count recommendations. Applicable if your organisation supplies into, or handles product regulated in, the US market: work to the chapter text directly rather than paraphrasing it.
21 CFR Part 11
FDA criteria for trustworthy electronic records and electronic signatures: audit trails, access control and retention requirements. Part 11 governs how mapping and monitoring data must be captured and kept, not how the study is designed. Applicable if your organisation supplies into, or handles product regulated in, the US market.
The platform
The Darca Suite
One complete platform for monitoring laboratories, biobanks, clinics and regulated environments.
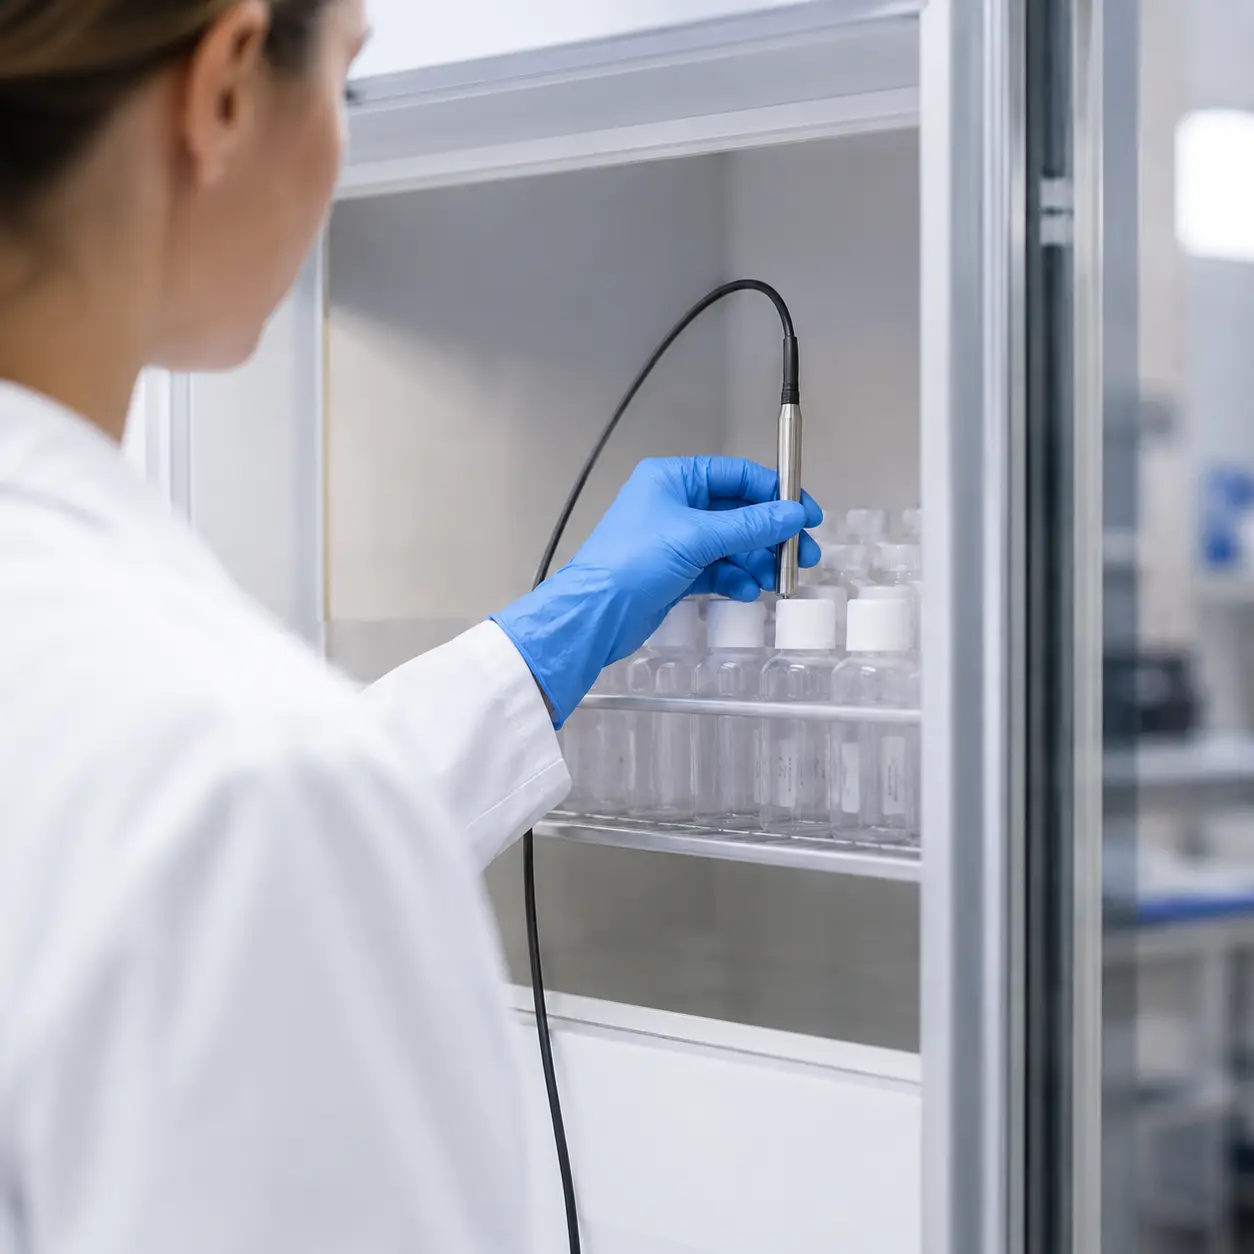
Darca Collect
Wireless GenII transmitters and high-accuracy wired probes matched to ULT freezers, cold rooms, incubators, IVF equipment and stability chambers.
Explore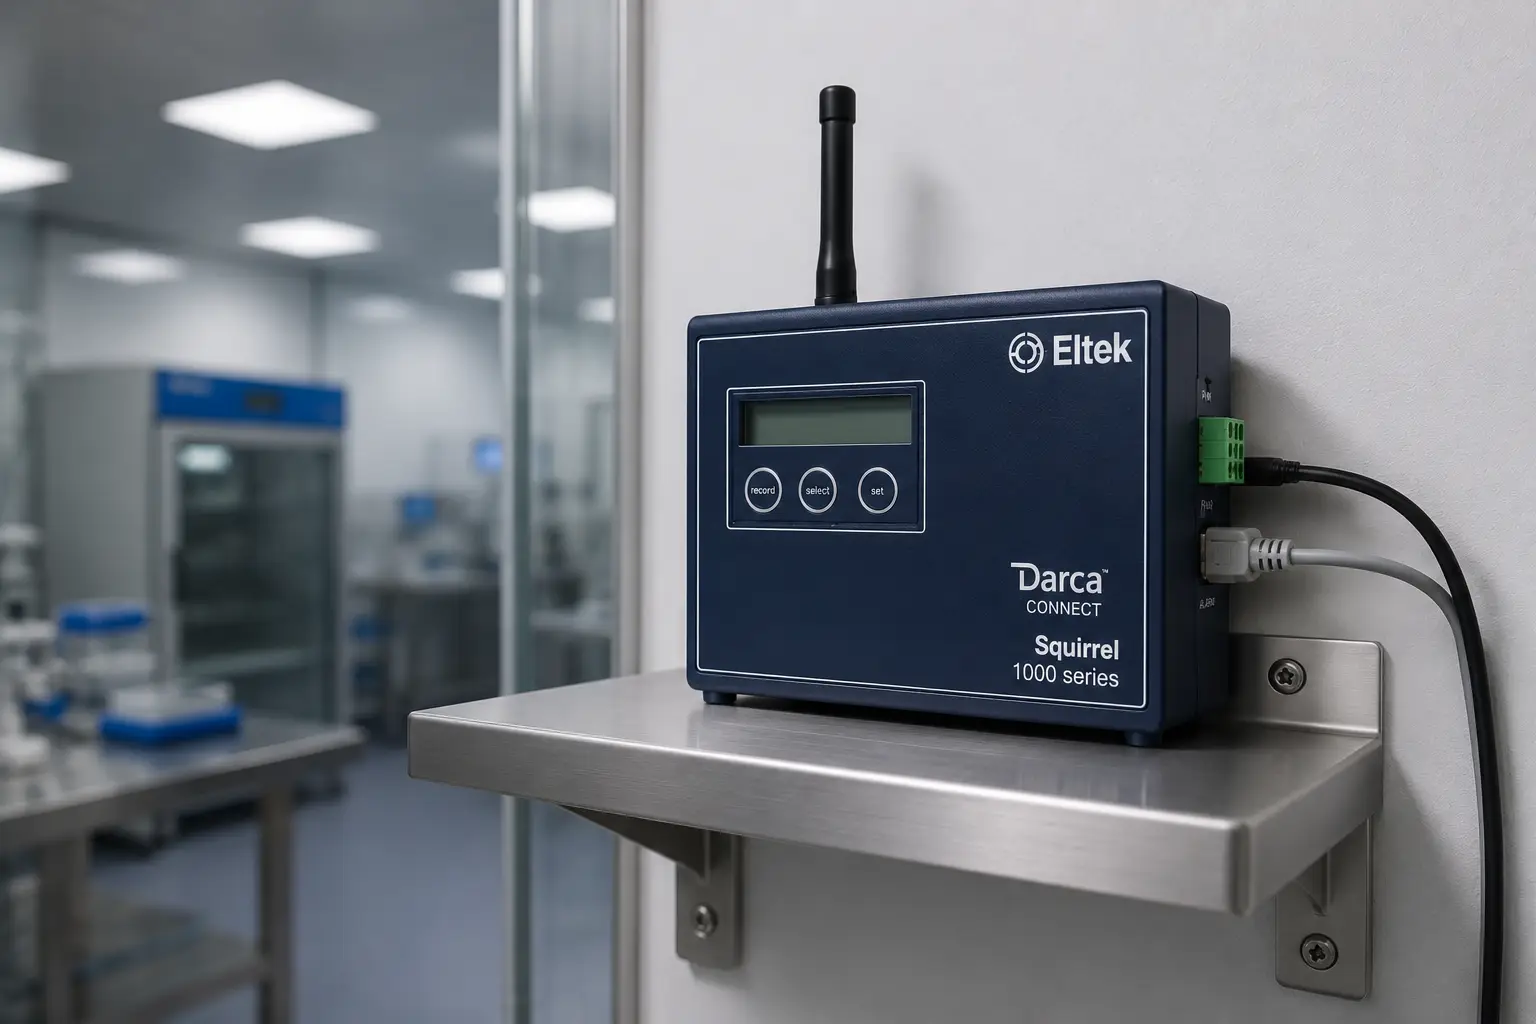
Darca Connect
The SRV450 hub gathers the network and SMS450 alarms escalate an out-of-tolerance excursion to the right person instantly, so samples are protected.
Explore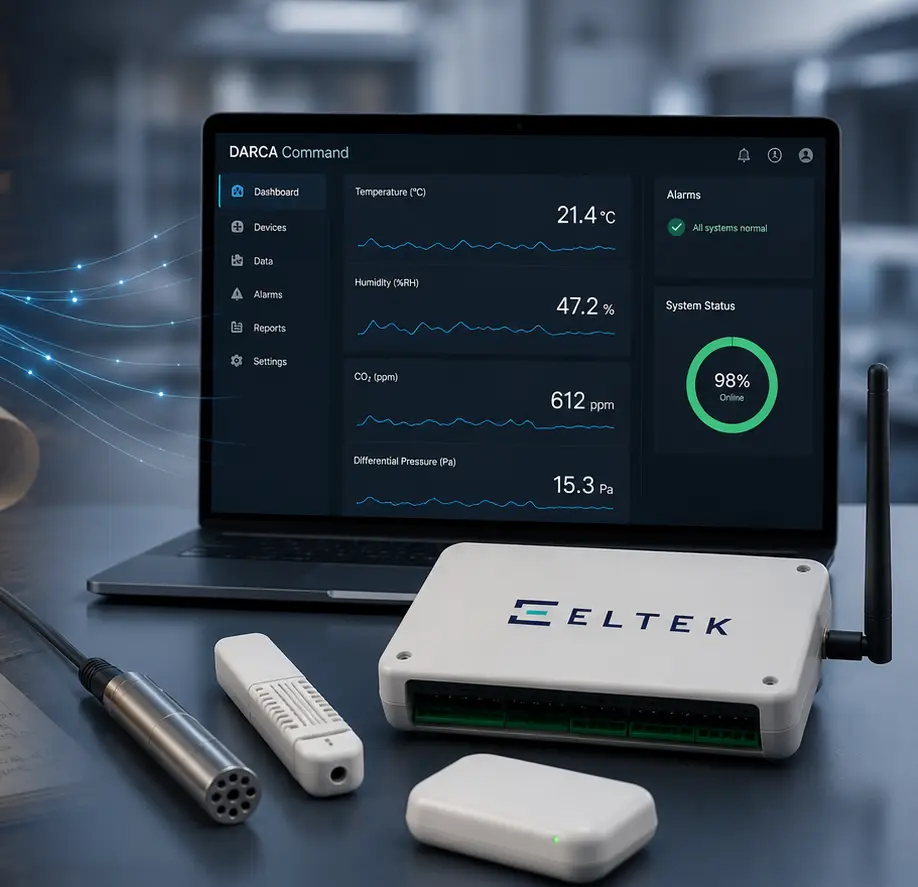
Darca Command
Compliance-ready dashboards, audit trails and scheduled reporting built for GxP, GMP, HTA, ISO and 21 CFR Part 11 environments.
ExploreSpeak to an Eltek expert about the right equipment for your mapping study
Tell us the spaces, the temperature ranges and the number of measurement points your protocol calls for, and our engineers will help you specify the loggers, probes and Darca software to match.